Neat way to filter good Singapore REITs
REIT Price/NAV vs Dividend Yield
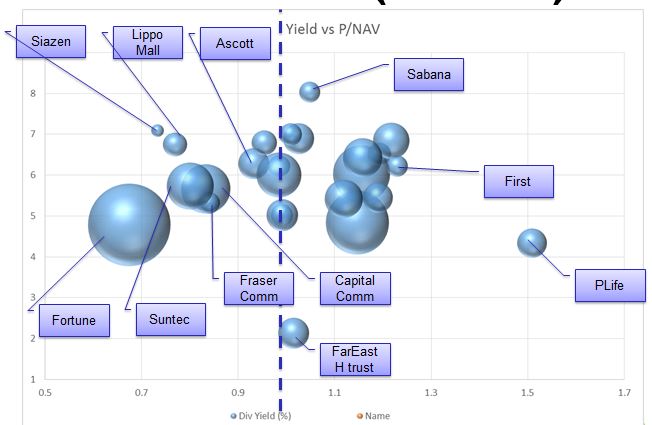
If you like me is a visual person, will like the below graphical representation of all the Singapore REITs in a single chart. Framed by Price/NAV on the X-axis and Dividend Yield on the Y-axis.
In my earlier article, I talked about why I use the 2 criteria as my first pass filter. Price/NAV gives me a gauge of how much I am paying for the asset that the REIT owns. If the value is less than 1, it means I am buying the counter with a discount. For Dividend Yield, the higher the better.
How do I use the REIT chart?
Well, I will start my filter by ignoring those that have higher than 1 P/NAV ratio. I want to have a buffer on the value of the assets thus I will not look at anything on the right side of the dotted blue line. The top 5 most “discounted” Reits are :
- Siazen Residential Reit
- Lippo Retail Mall Reit
- Fortune Reit
- Suntec Reit
- Fraser Commercial Reit
If you set yourself a dividend requirement of at least 6%, you are now only down to Siazen Reit and LippoMall Reit.
Saizen REIT
I did a little more investigation Siazen Reit and found this company and their model quite interesting.
- Unlike other REITs in Singapore, their load that they borrow from Japanese Banks do pay down the principles! Meaning after paying the load for 10,20 years, they will actually own the freehold land. Which means, they can then use the paid up collateral to get more loans to expand! How cool is that? All other local REITs do not have that structure in place. So for others to expand, they can only get more loans or issue rights.
- In their up coming EGM, they are proposing a 5 to 1 share consolidation. Meaning, based on current price of $0.18, when approved, it will then start to trade at S$0.90 or so. By doing so it helps to reduce the percentage volatility of single tick PLUS… puts them closer to the unspoken special price of $1, where institutional buyers will start to get interested.
Disclaimer: I am vested in Saizen REIT, so this is not a recommendation to buy anything. What I mentioned above is for educational and sharing purpose only.
this article first appeared in www.myfcoach.com

Very good way to interpret it using this chart for stock analysis. I may have miss. Can you tell me what is the different size of the balls mean ?
Hi Cory,
Good question! No you did not miss out anything. It is I who forgot to add it in. The size of the balls means their market capitalization (share price X # of shares). The bigger it is the more stable is the company (most of the time). For Saizen REIT it stands at S$258M and Lippo Mall is at S$958M. Hope that helps! and thanks for the question!
[…] Reits actually pays down the principles of their loan with each payment. I talked about this before here. What this means is that their repayment amount is higher thus less distribution for shareholder. […]
[…] actually pays down the principles of their loan with each payment. I talked about this before here. What this means is that their repayment amount is higher thus less distribution for shareholder. […]
recently i saw the consolidation happening an I bought some stocks at 0.189 and 0.2, I wonder how do I calculate my original investment now that its consolidate, could you advice thanks!!
Hi Zen, If I understand your question correctly, you want to calculate how much was your cost of investment after consolidation right? Well, it will have to start from the average cost you bought initially. For example if you bought 10K shares at 0.189 and 5K shares at 0.2, your average cost of your investment would be =(10KX0.189)+(5KX0.2)/(10K+5K)= 0.193 per share. after 5 to 1 consolidation, your cost will be 0.963 and you have (15K/5)=3K shares. Make sense?
May I ask is it a good investment in soilbuild REIT ?
Since u mentioned that u will only look at nav below 1.0
Hi Ekim,
I was out of the country for a while and missed your comment. Apologies. Well, answering your question now is pointless, as we all know the current price is still below the IPO price of $0.78 (-3.8%), so on hindsight I am glad I did not participate even though the yield was good. I have been to one of their property (One-North) and it is not very happening. You don’t get the feeling that place is the center for doing business. Moving forward, I will continue to monitor this counter. Currently its P/NAV is about 0.945. Not every attractive and not every expensive too. So I will monitor it for a while and let the dust settle a little bit.
[…] actually pays down the principles of their loan with each payment. I talked about this before here. What this means is that their repayment amount is higher thus less distribution for shareholder. […]
[…] have wrote an article here about my basic consideration when picking REITS here. Basically, I filter my REITS using a single simple ratio of Yield over Price/NAV. At that time, […]